Implemented Grafana and Prometheus to unify metrics across my server fleet, enabling quick, secure logins for fleet‑wide visibility — no more hopping between different Netdata instances.
The Start
When you're running multiple servers across different clouds, flipping between seperate dashboards isn't just tedious - it can be a blind spot.
Previously, I was running a Netdata instance for each server I wanted to monitor, but after getting more familiar with Grafana and Prometheus exporting metrics - I realized what I was missing, and that this was perfect for the fleet.
The Problem
Operational pain points:
- Multiple logins, inconsistent views
- Harder to spot fleet-wide trends
- Alerting scattered across instances
Being able to unify my server dashboards across a single Grafana instance, with Prometheus exporting metrics gives me a much more unified look of my fleet.
Quicker to spot any issues with instance uptime, better security (one Grafana instance vs multiple Netdata instances, previously secured by reverse proxies via NGINX or Caddy), and it's much more efficient to just pull metrics we need rather than the broad ones Netdata typically pulls for all instances.
The Goal
- Single, secure login for all metrics across the fleet
- Consistent visual language across dashboards
- Scalable design that grows, as the servers do
The Build
Architecture Overview
[ Exporters on Triton ]   → [ Prometheus Triton ]   ↘
[ Exporters on Zephyrus ] → [ Prometheus Zephyrus ]  → [ Grafana (Triton) – Central Dashboard ]
[ Exporters on Iris ]     → [ Prometheus Iris ]     ↗
[ Exporters on Homelab ]  → [ Prometheus Homelab ]
Authentication handled entirely by Grafana, for simplicity and security.
Using this architecture allows us to keep Prometheus local to each node, for optimal resilence - with one server running Grafana as the aggregation and visual layer on top of that.
Setup Highlights
Prometheus scrape config on Triton:
global:
  scrape_interval: 15s
  evaluation_interval: 15s
  scrape_timeout: 10s
  # External labels help identify this node in a multi-node Grafana/Prometheus setup
  external_labels:
    environment: triton
    location: local

scrape_configs:
  # Prometheus itself
  - job_name: 'prometheus'
    basic_auth:
      username: patrick
      password: sanitized
    static_configs:
      - targets: ['127.0.0.1:9090']
        labels:
          node: "triton"

  # Triton system metrics
  - job_name: 'node'
    static_configs:
      - targets: ['127.0.0.1:9100']
        labels:
          node: "triton"

  # CrowdSec (only local-origin bans + alerts)
  - job_name: 'crowdsec'
    metrics_path: /metrics
    static_configs:
      - targets: ['127.0.0.1:6060']
        labels:
          node: "triton"
    metric_relabel_configs:
      - source_labels: [__name__]
        regex: 'cs_active_decisions|cs_alerts'
        action: keep
      - source_labels: [origin]
        regex: 'crowdsec'
        action: keep

  # Docker daemon metrics
  - job_name: 'docker'
    static_configs:
      - targets: ['127.0.0.1:9323']
        labels:
          node: "triton"

  # cAdvisor for per-container stats
  - job_name: 'cadvisor'
    static_configs:
      - targets: ['127.0.0.1:8083']
        labels:
          node: "triton"
Data source is then added on Grafana - ex: for Triton, localhost:9090 - since it's running on the local server, and we have metrics incoming.
Current State
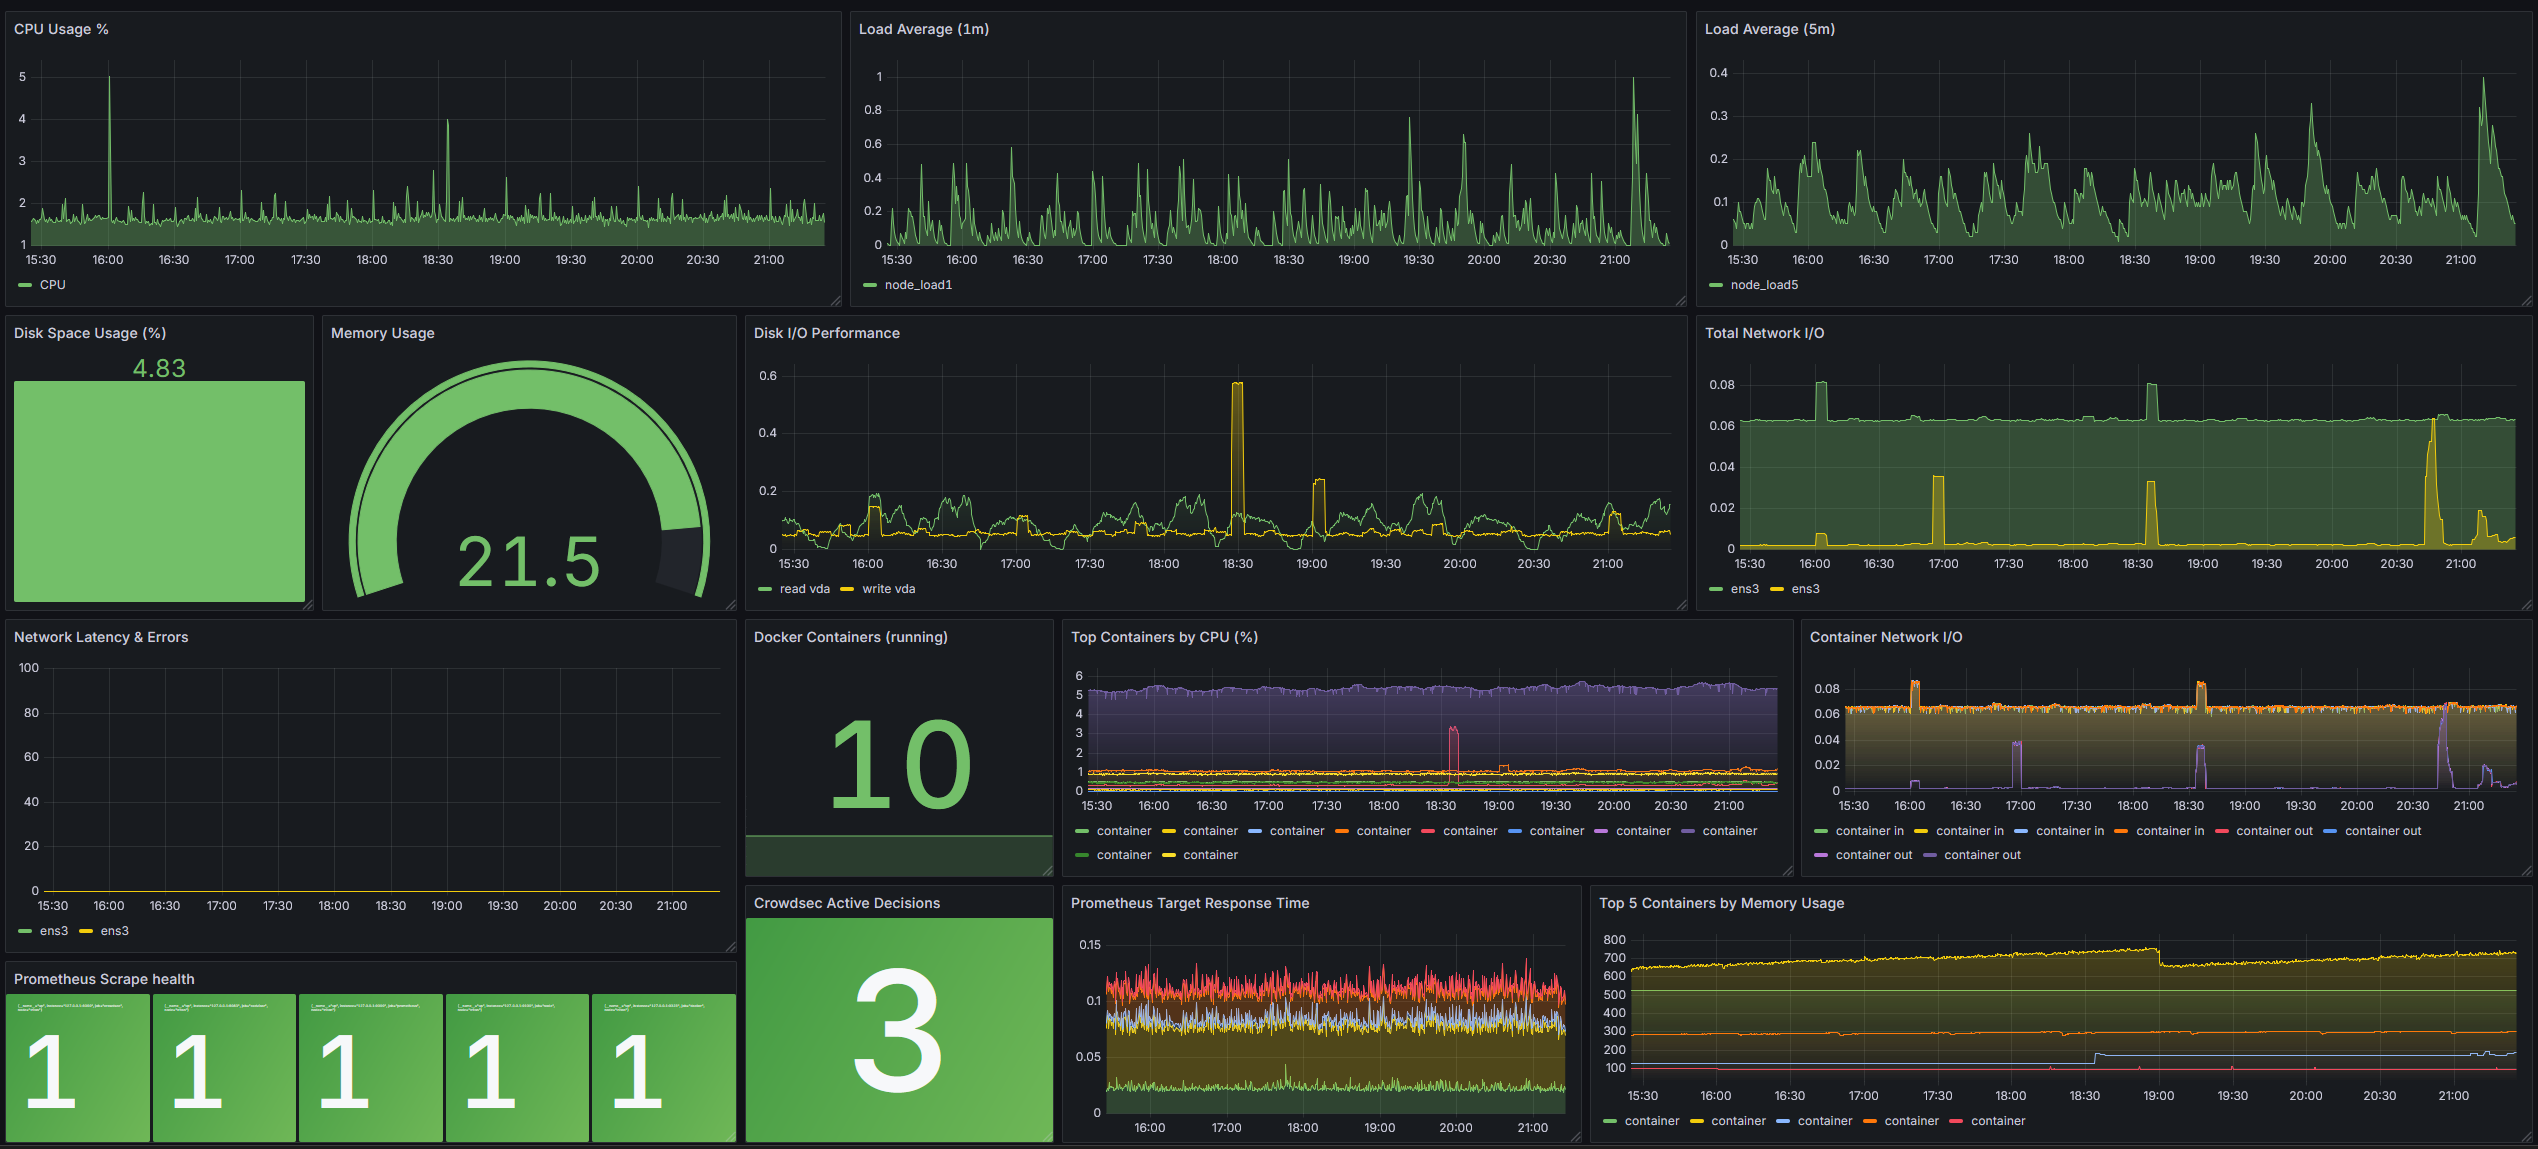
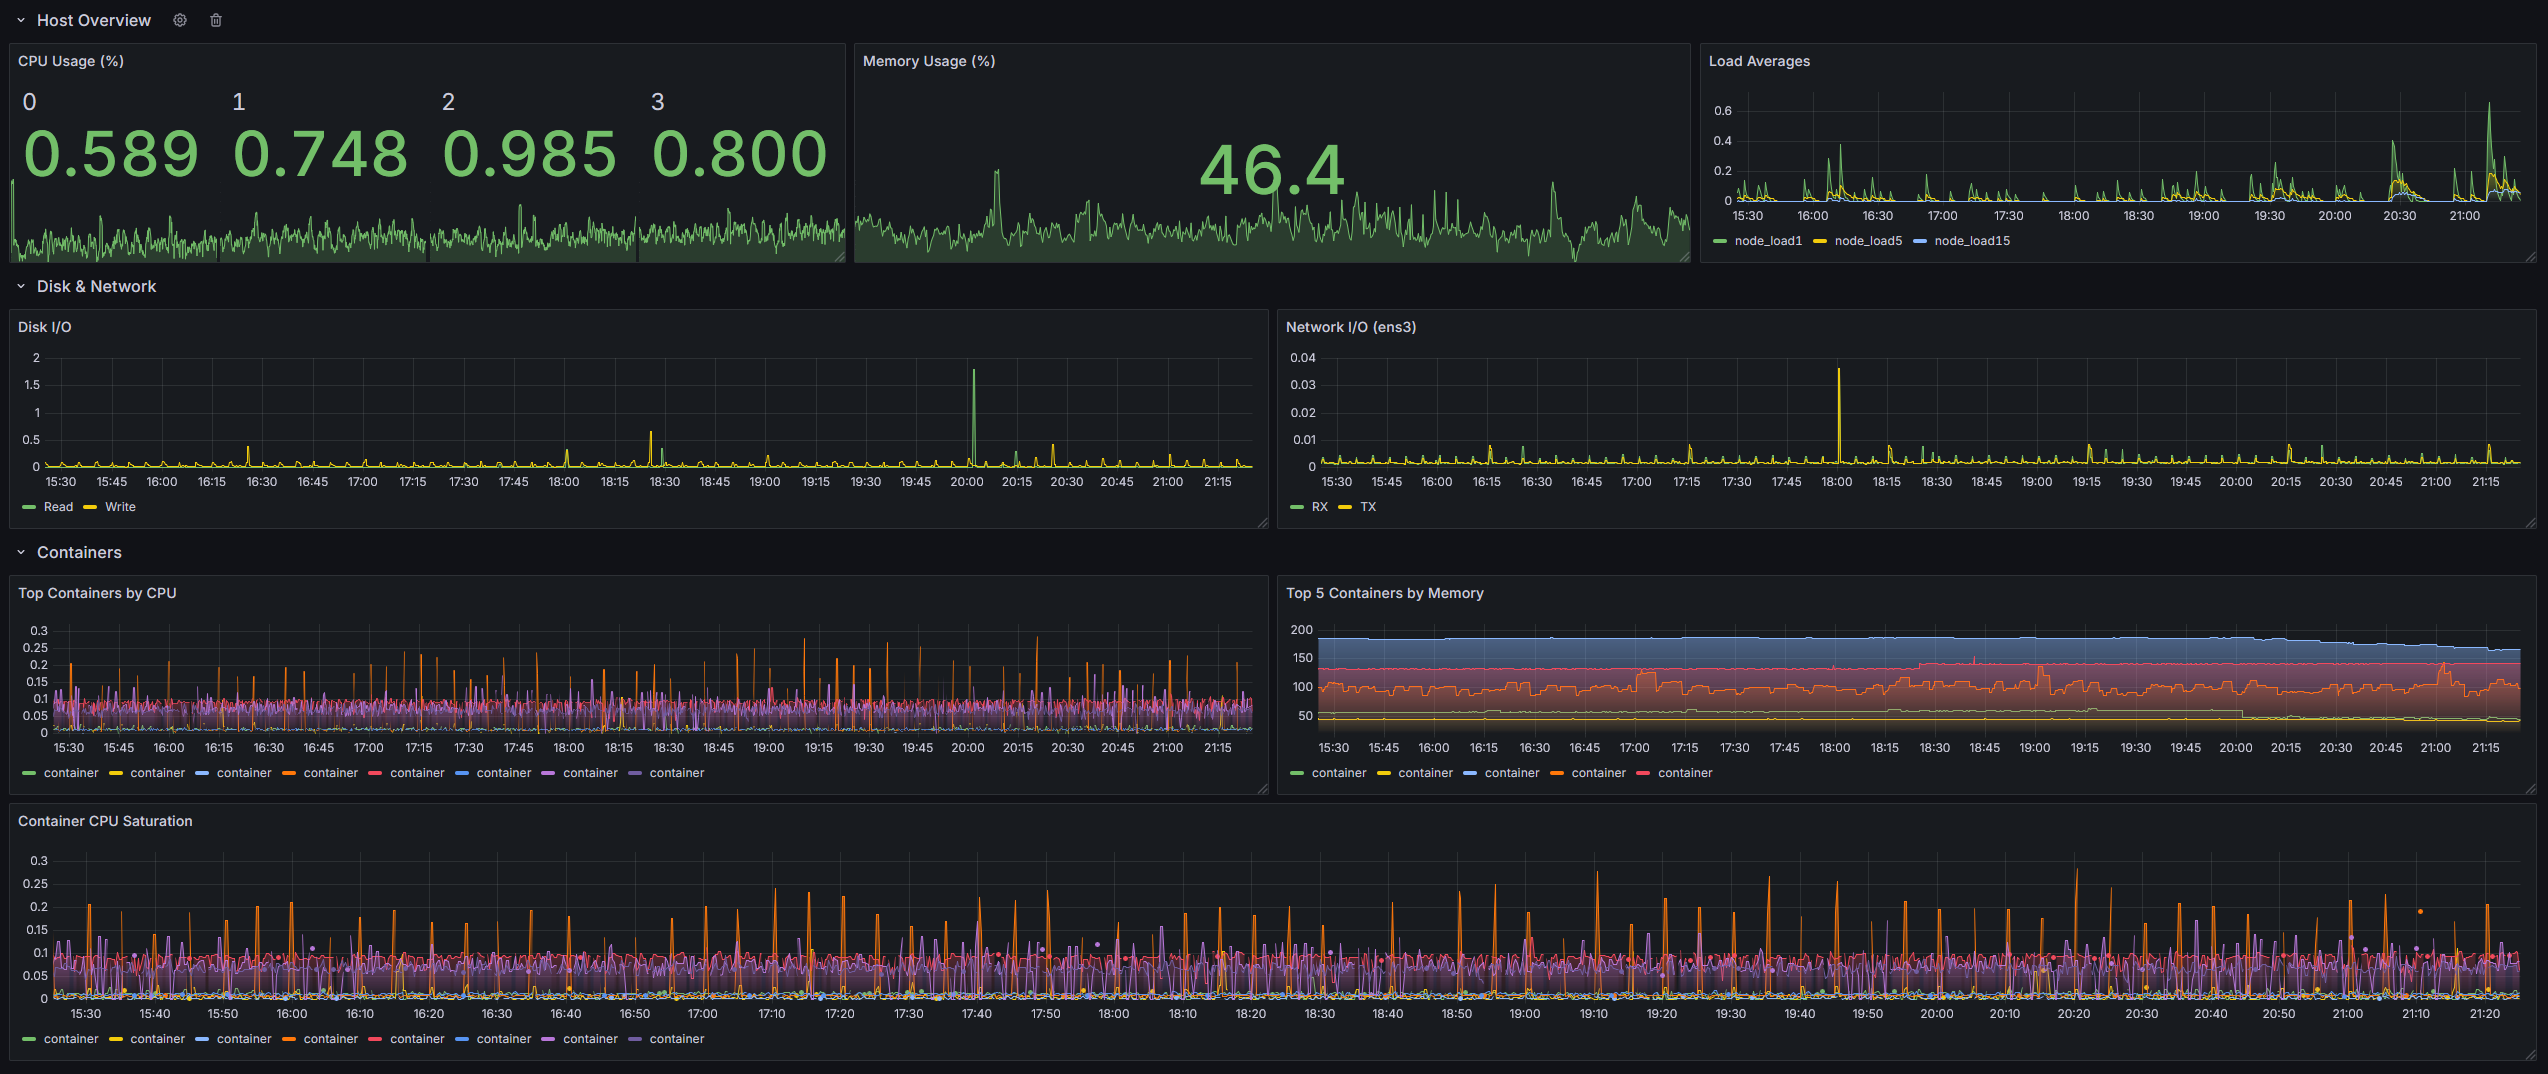
Benefits already gained
- Faster access
- Set and forget
- Centralized authentication
Limitations
- Still need to switch dashboards for cross-server comparisons
Roadmap
Next up: unify into a fleet‑wide dashboard that looks great and scales to every server in the fleet. CrowdSec is already integrated; next, I’m working on building a pipeline to pull per‑server vulnerability data from Trivy JSON into Grafana - turning the dashboard into a live security and performance command center.