Live attack data from multiple servers, unified with Python, Flask, and Gunicorn, and brought to life on a Plotly world map.
Why I Built This
For awhile, I've had threats.beane.me running in the background, fully automated with aggregation between multiple nodes. I was very happy with how the project turned out - and it made me realize how important visualizing these threats and attackers is. So, after a little musing, I decided to take those decisions from CrowdSec that are already shown there and paint them on a map using MaxMind's GeoIP geolocation.
It's running in real-time, with a few Python scripts - main one through Flask and Gunicorn (for load-balancing), and shows attackers not only by their IP but also their location (sanitized lat/long, so only xx.xx is used).
Stage 1: Per-Server JSON
Each server within the stack that is getting pelted with cscli decisions, is now running a Python script to build JSON with entries based on bans per day, per country, and a geo_clusters list filled with latitude/longitude coords for Plotly to utilize and draw on a map. It keeps a count based on bans per each cluster, so we can paint an elegant picture and a heatmap based on 0 to 30+ attempts.
Timestamps are converted to local time (so all intrusion attempts are easy to track), and we use a fetch_alerts function to pull relevant CrowdSec alerts - using a DAYS_ROLLING variable so only the last 30 days are pulled:
def fetch_alerts():
    # Run CrowdSec CLI to get recent alerts in JSON
    result = subprocess.run(
        ["cscli-alerts", "--since", f"{DAYS_ROLLING}d", "-o", "json"],
        capture_output=True, text=True
    )

    alerts = json.loads(result.stdout or "[]")

    # Filter out whitelisted events
    return [
        a for a in alerts
        if any(d.get("type") != "whitelist" for d in a.get("decisions", []))
    ]
Stage 2: Aggregating Multiple Feeds
Surely one server feeding into intel.beane.me couldn't be enough - the next step was aggregation and getting feeds from multiple servers so the map would truly light up. With this we merge the previous lists, including the country counts, daily ban history, and geo-clusters for the map. Using a merge_feeds() func which can take multiple JSON files as an input - ex:
iris = load_json("data/threats_iris.json")
triton = load_json("data/threats_triton.json")
zephyrus = load_json("data/threats_zephyrus.json")

merged = merge_feeds(iris, triton, zephyrus)
We use merge_feeds() to process this JSON and aggregate the lists:
# Combine per-server feeds into a single dataset
total_bans = sum(f["overview"]["total_bans"] for f in feeds)

# Merge country counts
agg_counts = defaultdict(int)
for f in feeds:
    for entry in f["country_counts"]:
        agg_counts[entry["country"]] += entry["count"]

# Top 5 offending countries
top_countries = sorted(
    [{"country": c, "count": cnt} for c, cnt in agg_counts.items()],
    key=lambda x: x["count"],
    reverse=True
)[:5]

# Merge daily history
history_map = defaultdict(int)
for f in feeds:
    for h in f["history"]:
        history_map[h["date"]] += h["bans"]

history = [{"date": d, "bans": history_map[d]} for d in sorted(history_map)]
Stage 3: Serving the Data
Since I've gotten so familiar with Python lately, I decided to utilize Flask and Gunicorn (for load-stabilizing), to get a dynamic map for Intel that was frequently updated with live “intel” fed in from the CrowdSec logs via the aggregated JSON.
A few routes are available in Flask:
- / → Map view
- /history → Timeline of bans
- /countries → Top offending countries
- /api/* → JSON endpoints for access
Visualizing the Intel
Maxmind GeoIP is used for the incoming IP bans, to get a good baseline of where the “offending” intel comes from, namely their latitudes and longitudes that we sanitize a bit so we can paint it on our world map. History graphs are also generated with the aggregated data from other nodes, which happens about every 10 minutes via cron.
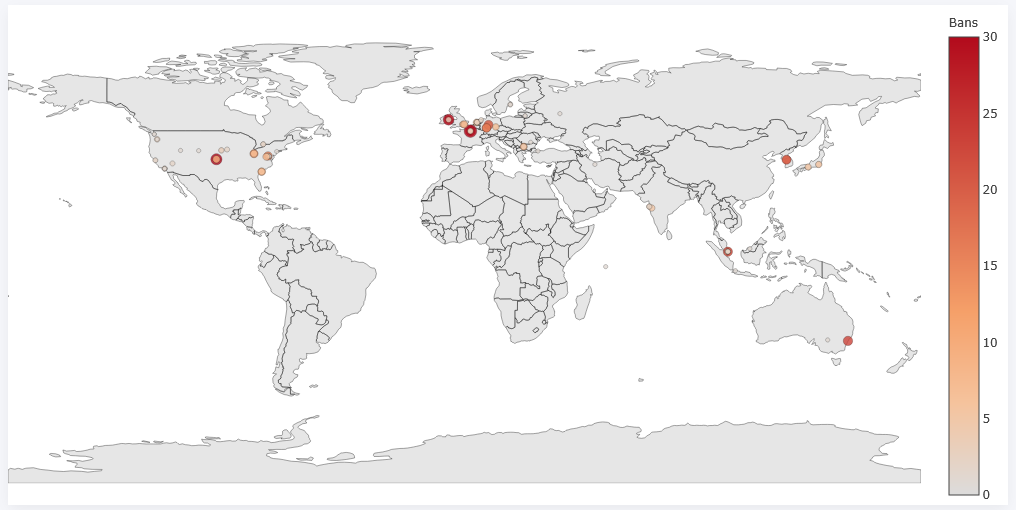
Live Plotly map with aggregated CrowdSec Intel
Lessons Learned
I knew right away, after learning with threats.beane.me that one server feeding data isn't enough. Aggregation is key, and in this case - the more the merrier. We use a 30 day rolling window, hard-coded as DAYS_ROLLING, so if I ever was to change it, and go to 90 day, 14 day, etc - it's very easy to make a simple change for retention.
It's also important not too much data is given away, even on the attackers. No sensitive IPs or information are exposed beyond what is already public, and lat/long's are sanitized so they aren't a precise lookup.
What's Next
I'm thinking sometime in the future, we may end up building a slick visualization with all this data allowing you sort with a slider based on each day on the main heat map, to allow users to get a better correlation of when these attacks are happening. They're all live on the other threats project, but being able to go day by day on the heat map would really push this to the next level.