Turning nightly scans into a living story of resilience - vuln.beane.me shows how vulnerabilities rise, fall, and resolve.
The Importance of Vulnerability Awareness
A lot of people run docker containers without much of a second-thought; and while this can work in practice, it's not necessarily the best or most secure way to go about things. If there is a serious vulnerability in one, it's something I'd want to be well-aware before other more unscrupulous actors are. Containers aren't inherently secure, and the ease of rapid deployment with docker means the risk can potentially spread rapidly as well.
Proactive scanning (nightly) and timely patching (daily) are the best things we can do to combat these possible vulnerabilities, when implemented right.
The Stack
In order to address this, I've implemented Trivy across much of my infra to get more insights into security and safety, as well as automating it so scans are run on the child nodes between 2-3 AM so we can take this data, sanitize and aggregate it - which we've in turn used for a public dashboard at vuln.beane.me.
Getting watchtower running was the easy part, but patching these vulnerabilities is just as critical as becoming aware of them in the first place.
Architecture Overview
          ┌───────────────────────────┐
          │         Triton            │
          │  (Master / Aggregator)    │
          │                           │
          │ - Docker + Watchtower     │
          │ - Trivy (local + merged)  │
          │ - rsync target dir        │
          │ - Fleet-wide report       │
          └───────────▲───────────────┘
                      │ (rsync push)
        ┌─────────────┼───────────────┐
        │                             │
┌───────┴──────────┐         ┌────────┴─────────┐
│    Zephyrus      │         │     Apollo       │
│   (Child Node)   │         │   (Child Node)   │
│                  │         │                  │
│ - Docker         │         │ - Docker         │
│ - Watchtower     │         │ - Watchtower     │
│ - Trivy (scans)  │         │ - Trivy (scans)  │
└──────────────────┘         └──────────────────┘
The Process
Using a simple bash script, we start off by defining the server we're running the scan on, as well as our desired containers we want to run a scan on - then build a JSON file for each image.
#!/bin/bash

server=zephyrus
images=("caddy:latest" "portainer/portainer-ce:latest" "containrrr/watchtower") # small list of containers to scan

for img in "${images[@]}"; do
  # Extract image name without registry or tag
  name=$(basename "${img%%:*}")

  # Construct output file: trivy_${server}_${name}.json
  output_file="data/trivy_${server}_${name}.json"

  echo "Scanning $img -> $output_file"
  trivy image --format json --output "$output_file" "$img"
done
Next, we take our results per server, and aggregate all the JSON together (so we have the complete JSON for each server):
# Folder where all Trivy JSON outputs live
trivy_dir = Path("data")
output_dir = Path("aggregate")

# Glob all JSON files
json_files = trivy_dir.glob("trivy_*.json")

server = "zephyrus"
aggregated = []
file_count = 0

for file in json_files:
    with open(file, "r") as f:
        data = json.load(f)
        data["image_name"] = file.stem.replace("trivy_", "")
        aggregated.append(data)
    file_count += 1

# Now aggregated is a list of all scanned images with their results
with open(output_dir / f"trivy_{server}_aggregated.json", "w") as f:
    json.dump(aggregated, f, indent=2)
This is done on all child nodes, as well as the master; so we end up with a complete trivy_server_aggregated.json for each server that we can transport to the master (if ran on a child node).
Simple Aggregation
After getting the scans aggregated per server, we next needed to aggregate these per-server scans into a complete file that we could parse for vuln.
for file in json_files:
    with open(file, "r") as f:
        data = json.load(f)
        # Extract server name from filename: e.g., trivy_zephyrus_aggregated.json = zephyrus
        server_name = file.stem.replace("trivy_", "").replace("_aggregated", "")

        # Wrap each file's results with server info
        aggregated.append({
            "server": server_name,
            "results": data
        })

# Save combined JSON
with open(output_dir / "trivy_aggregated.json", "w") as f:
    json.dump(aggregated, f, indent=2)
Further Aggregation and Condensing Daily Scans
While having daily scans was the first part of the puzzle, I think where this project really shines with Trivy is the ability to monitor our infrastructure over time; so we in turn end up with daily / 7d / 30d rolling scans we can reference for our dashboard.
Here's the core of the aggregator we run on the main server, to prepare a JSON file that can be referenced on the dash:
def aggregate_scan(raw_data):
    total_counts = {"low": 0, "medium": 0, "high": 0, "critical": 0}
    per_server = {}
    latest_dates = get_latest_scan_dates(raw_data)

    for server_entry in raw_data:
        server_name = server_entry.get("server", "unknown")
        per_server.setdefault(server_name, {
            "server": server_name,
            "low": 0, "medium": 0, "high": 0, "critical": 0,
            "scan_friendly": latest_dates.get(server_name).strftime("%b %d %Y %H:%M %Z")
        })

        for image_block in server_entry.get("results", []):
            for result in image_block.get("Results", []):
                for vuln in result.get("Vulnerabilities", []):
                    if vuln.get("Status") != "fixed":
                        sev = vuln.get("Severity", "").lower()
                        if sev in total_counts:
                            total_counts[sev] += 1
                            per_server[server_name][sev] += 1

    # Collapse into a single "last scan" snapshot
    overall_last_scan_dt = max(latest_dates.values())
    last_scan = {
        "date": overall_last_scan_dt.strftime("%Y-%m-%d"),
        **total_counts,
        "total": sum(total_counts.values())
    }

    return last_scan, list(per_server.values())
Giving us a per-server vulnerability count - low, medium, high, and critical, as well as logging the date of the scan. We do a simple if vuln.get("Status") != fixed and take note if it hasn't been patched.
Building a Rolling History
One scan is a snapshot. Thirty scans, however; is a narrative. vuln.beane.me keeps a rolling window of the last 30 days, so we can see whether vulnerabilities are continuing to pile or actually getting patched.
def update_history(history_file, new_entry):
    try:
        with open(history_file) as f:
            history = json.load(f).get("history", [])
    except FileNotFoundError:
        history = []

    # Deduplicate by date, prepend new entry, trim to rolling limit
    history = [h for h in history if h["date"] != new_entry["date"]]
    history.insert(0, new_entry)
    return history[:ROLLING_LIMIT]
By default, ROLLING_LIMIT is defined as 30 to keep about the last month of scans.
Dashboard & Visualization
For this data to all be utilized properly, I wrote three similar files to take care of that - render_vuln_daily.py, render_vuln_weekly.py, and render_vuln_monthly.py to render daily, weekly, and monthly comparisons to see whether vulnerabilities are improving or trending worse over time.
All vulnerabilities are sanitized - while I keep unfiltered data on my own end that I can go through to check relevant containers if I see numbers spiking.
We start by collapsing all per-server counts into a single snapshot:
def render_summary(trivy_input):
    crit = high = med = low = 0
    for host in trivy_input:
        crit += int(host.get("critical", 0))
        high += int(host.get("high", 0))
        med += int(host.get("medium", 0))
        low += int(host.get("low", 0))

    return f"""
    <span class="critical">Critical: {crit}</span>
    <span class="high">High: {high}</span>
    <span class="medium">Medium: {med}</span>
    <span class="low">Low: {low}</span>
    """
In the case of render_vuln_weekly.py, the most important part is comparing today's scan to the one from 7 days ago:
def render_table(current, past):
    past_map = {h["server"]: h for h in past}
    rows_html = ""

    for host in current:
        today = sum(int(host.get(sev, 0)) for sev in ("critical","high","medium","low"))
        prev = sum(int(past_map.get(host["server"], {}).get(sev, 0))
                   for sev in ("critical","high","medium","low"))
        delta = today - prev

        if delta > 0:
            trend_class, trend_text = "trend-up", f"▲ {delta}"
        elif delta < 0:
            trend_class, trend_text = "trend-down", f"▼ {abs(delta)}"
        else:
            trend_class, trend_text = "trend-neutral", "No change"

        rows_html += f"<tr><td>{host['server']}</td><td>{trend_text}</td></tr>"
    return rows_html
Then we can determine not just how many vulnerabilities are present, but whether things are improving or regressing.
We keep a rolling history of 30 scans. By setting:
INDEX = 6 # compare today vs 7 days agoIt allows us to jump back exactly one week, which is the same mechanism that powers the 30-day view by indexing further back.
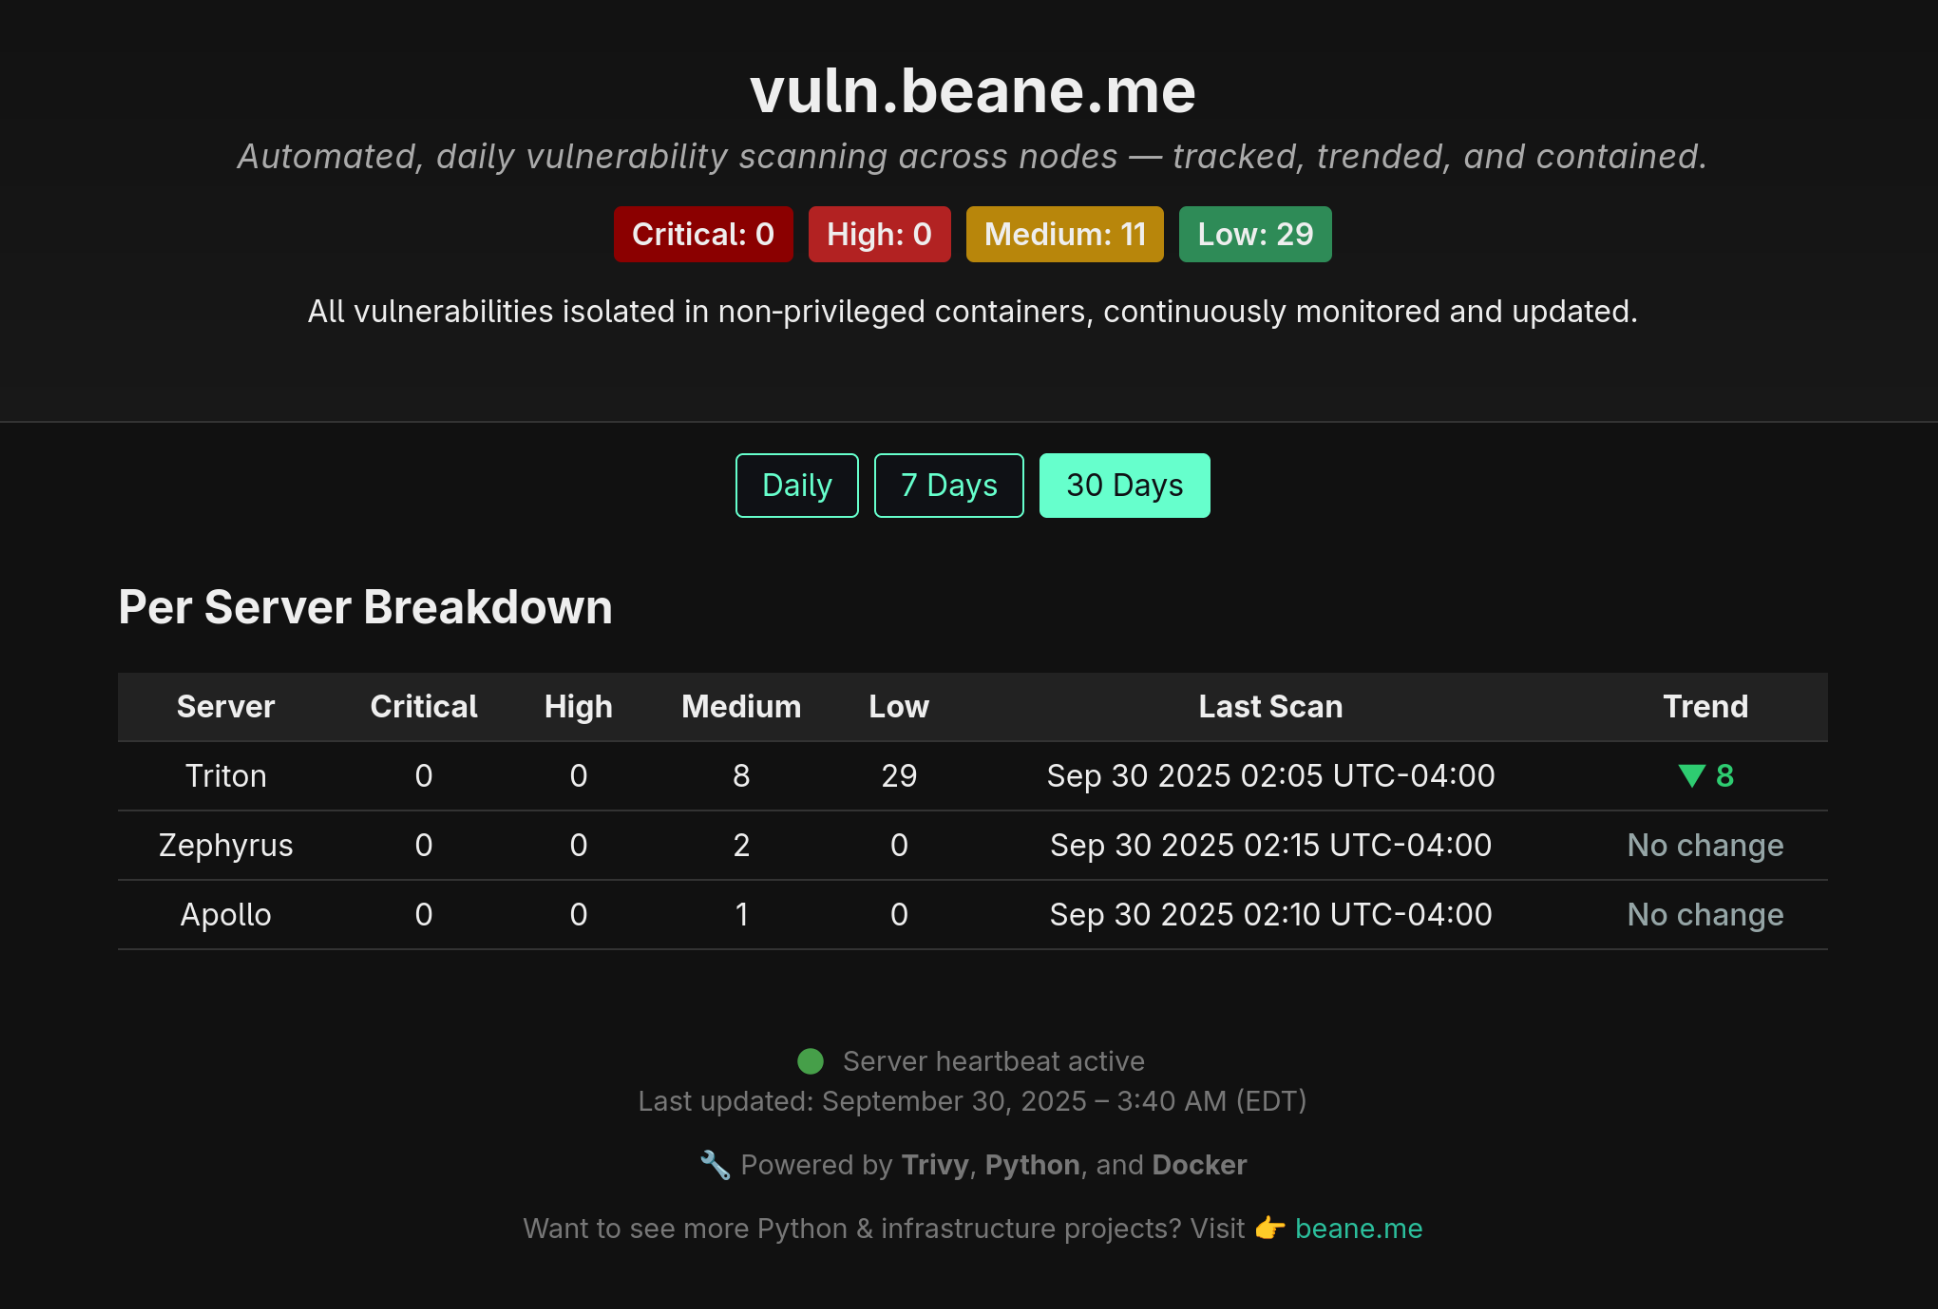
Here's the 30-day rolling view, generated on our dashboard nightly:
Operational Polish
Finally, every dashboard update is stamped with the exact time it was generated:
from datetime import datetime
from zoneinfo import ZoneInfo

est_now = datetime.now(ZoneInfo("America/New_York"))
last_updated = est_now.strftime("%B %d, %Y – %-I:%M %p (%Z)")
The Takeaway
- Summaries give the big picture
- Deltas tell the story of change
- History indexing lets us compare any two points in time
- Timestamps build trust in the data
All included, these small touches turn raw JSON into a narrative of security posture which is easy to read and hard to ignore.